Revision: c278821e8b
Edited Dashboard
@@ -13,13 +13,9 @@
-
-
**What Charts do we have?**
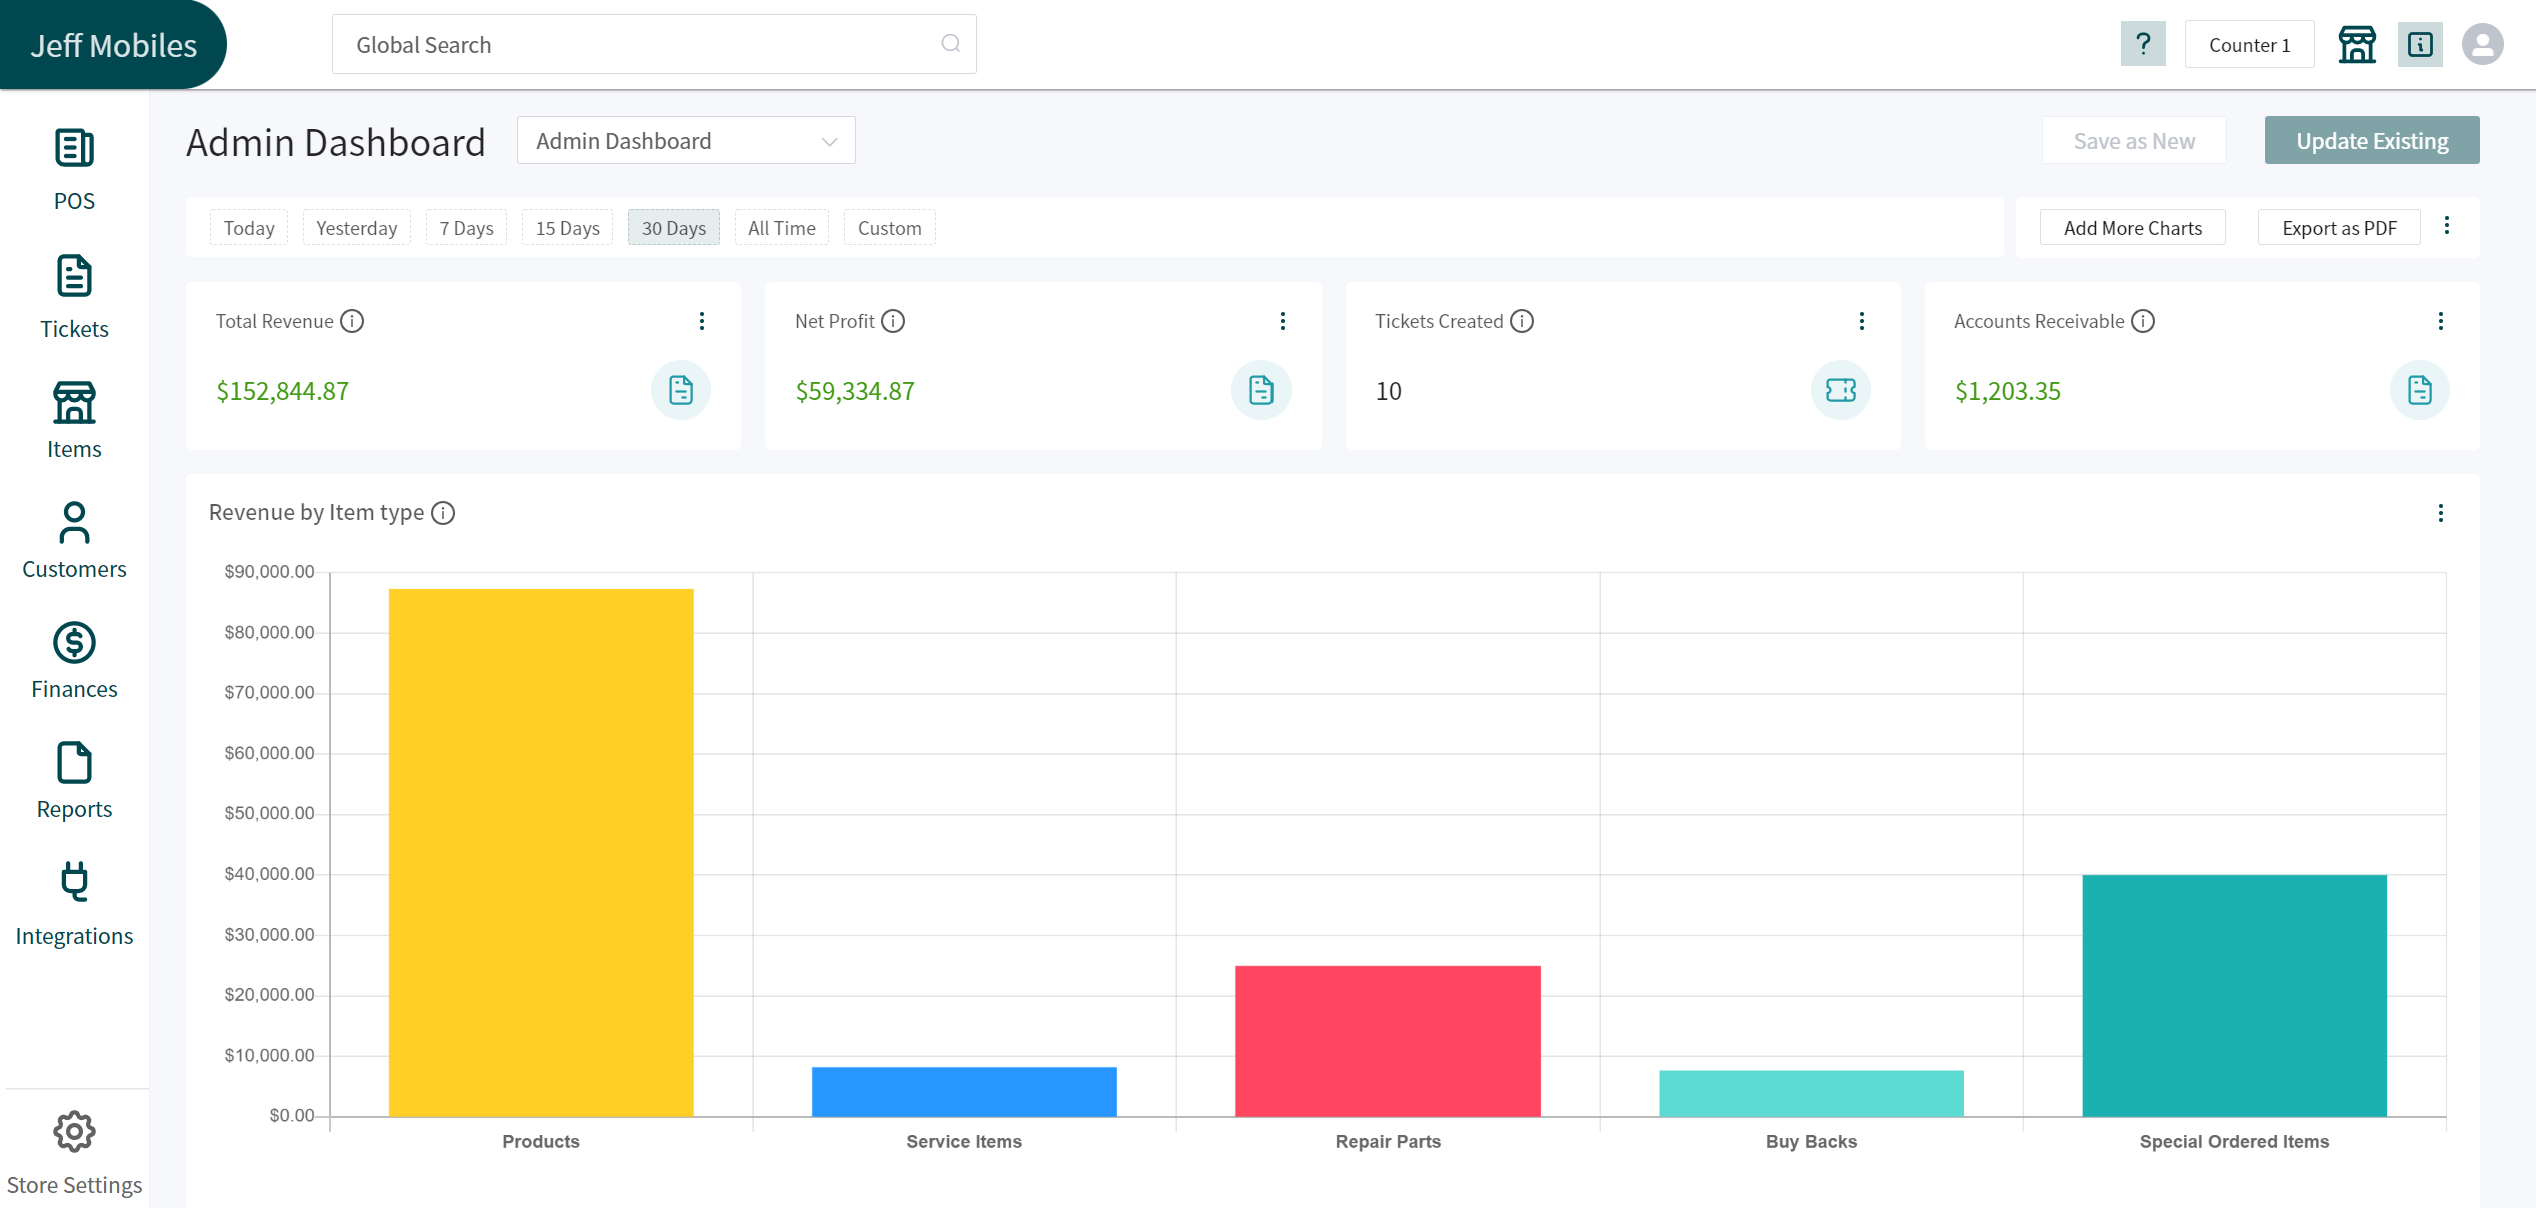
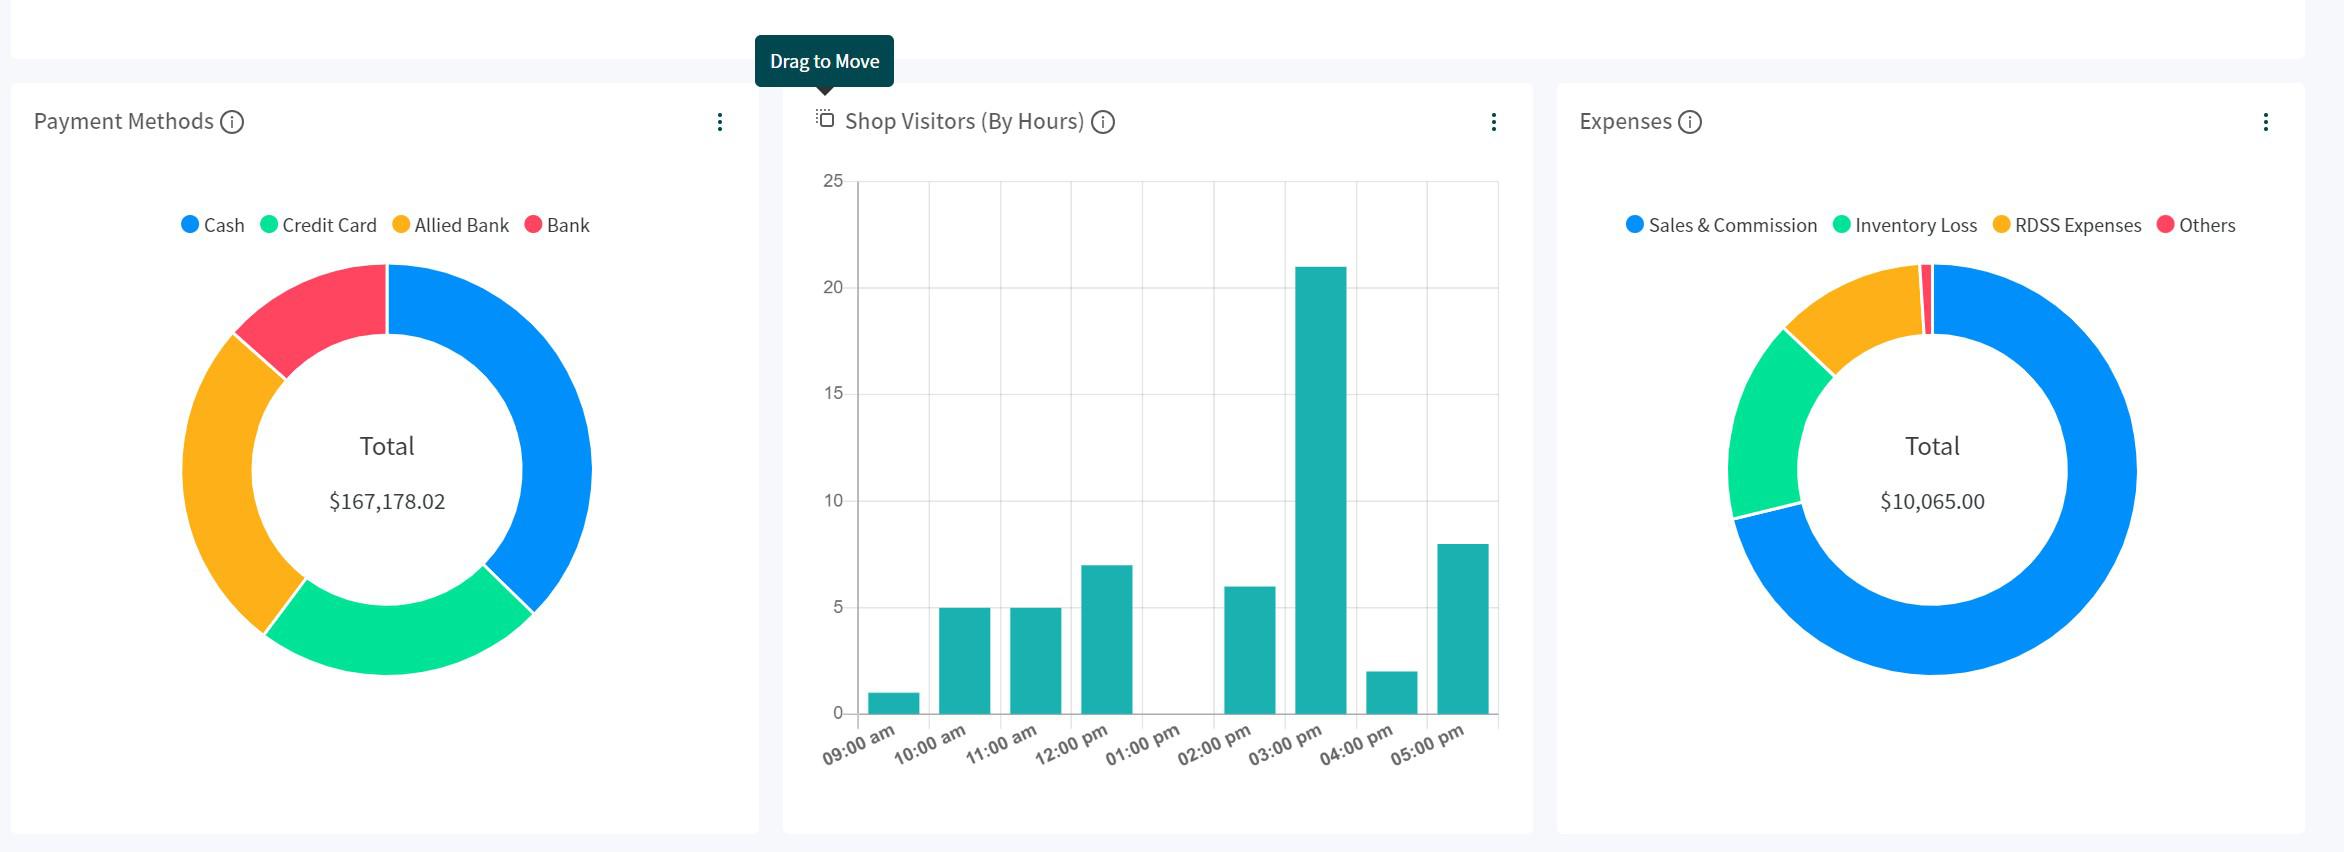
The Admin Dashboard is segmented into different **Metrics** and **Chart Types**. These chart types include having a line chart, a donut chart, and a bar graph. The line chart shows the user the progress over time, the donut chart shows the distribution and the bar graph would show you the absolute values concerning the categories.
-
-
**Moving things around**
@@ -27,21 +23,15 @@
-
-
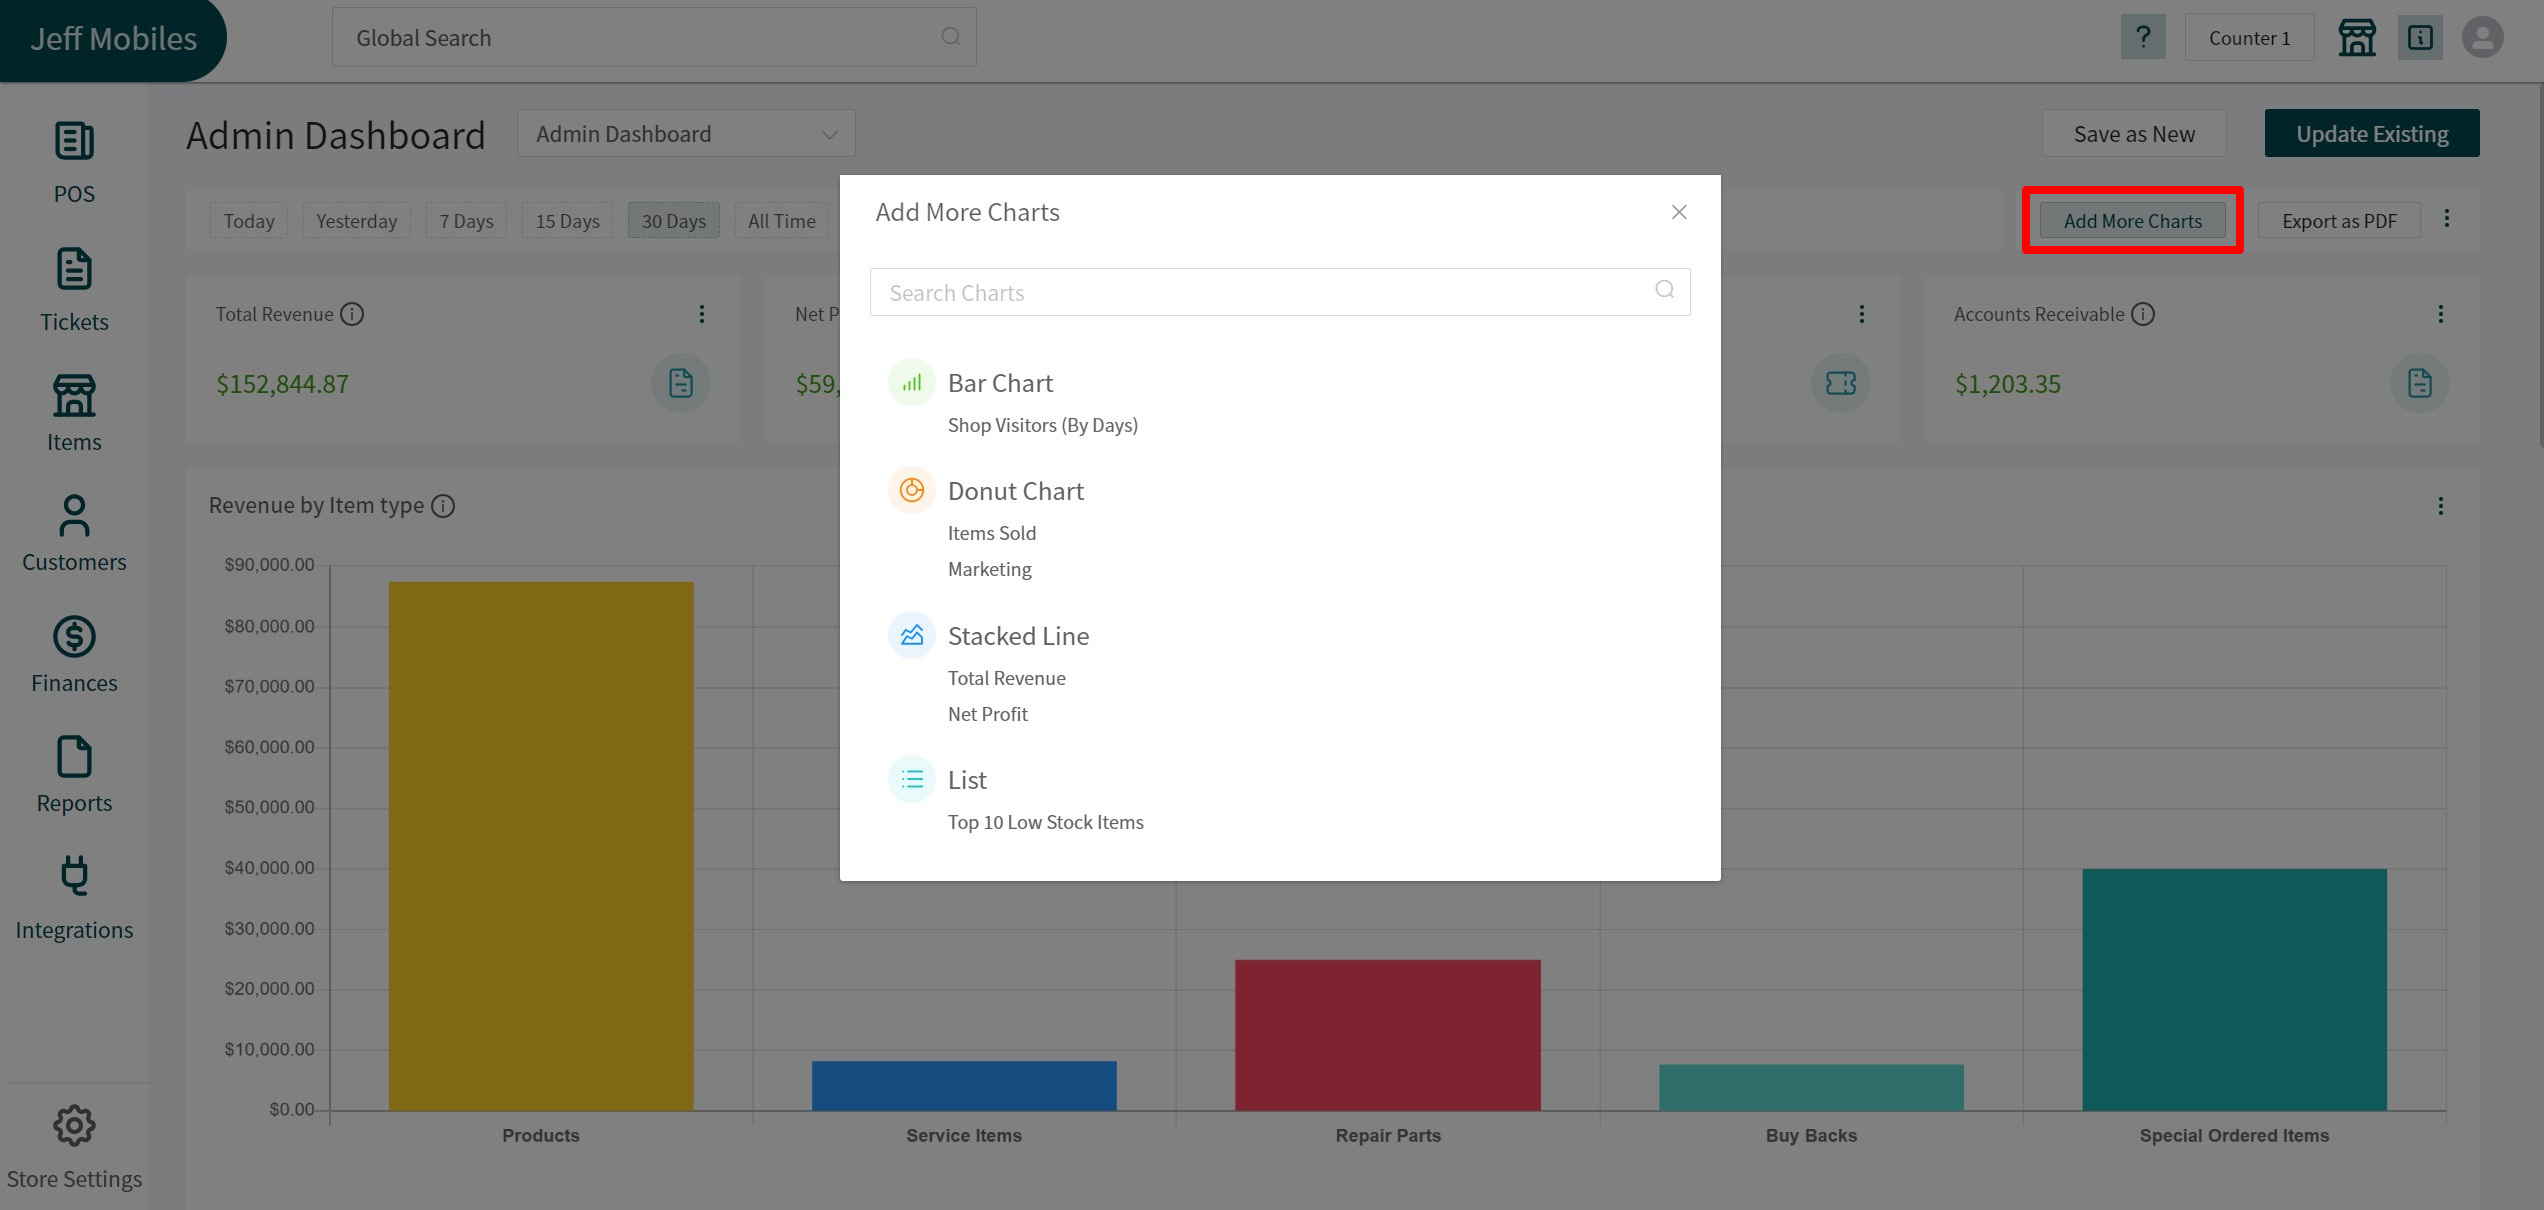
You can also add charts by clicking on the **Add More Charts** button in the top right of your dashboard. This will open up the charts you can add. This would only show you the charts that are not currently open in your dashboard.
-
-
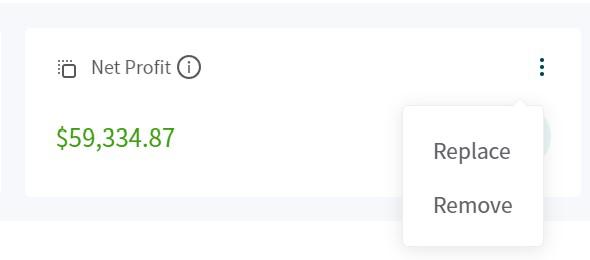
If you want to **Replace** an existing chart or metric with another one, you can click on the options button and select replace. This would replace one chart/metric with the new one you choose.
If you want to **Remove** an existing chart or metric, you can click on the options button and select remove. this would remove one chart/metric in your existing dashboard.
-
-
**Default Dashboard**
@@ -51,13 +41,9 @@

-
-
**Save as new**
RepairDesk allows its users to have as many different dashboards as they can. In order to save a new one, you can make changes to the dashboard and instead of updating the current one; you can save it as a new one by providing a name.
-
-
**Export as PDF**
@@ -67,8 +53,6 @@
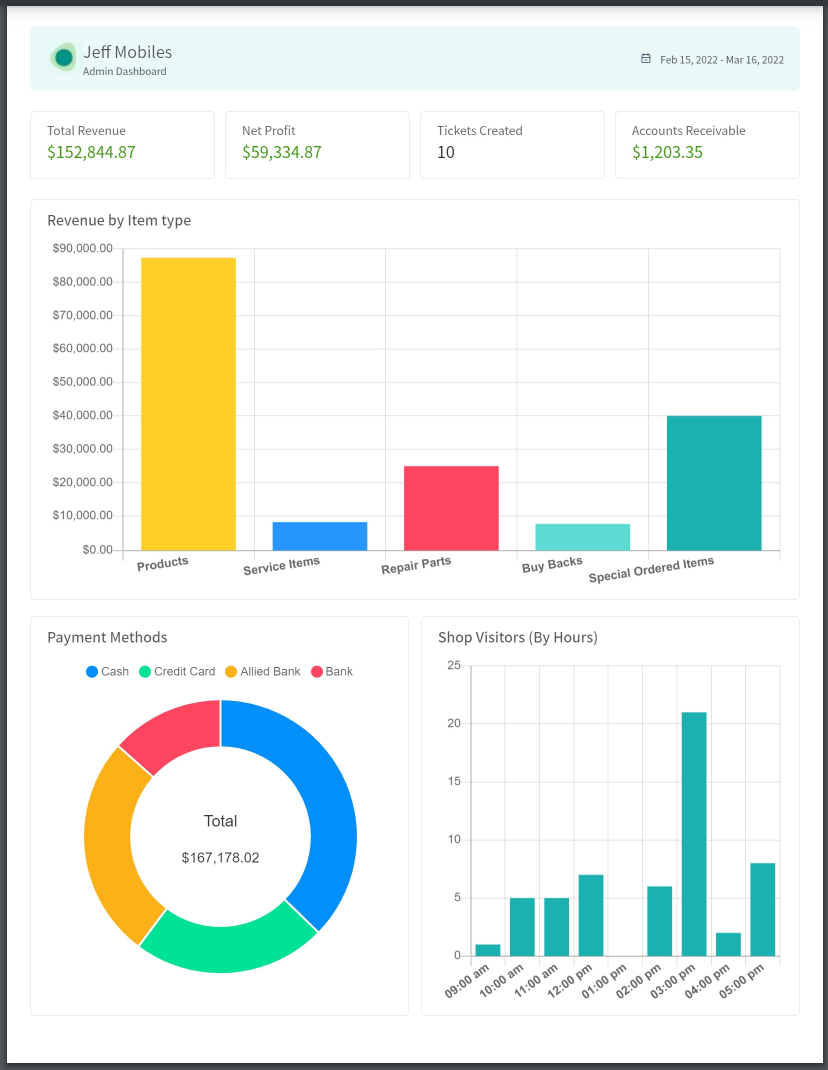
-
-
**Note:** In order to give the access of dashboard to your employees, head over to the following path.
> Path: \\Employee Roles and Permission > Create / Edit Role > Finances Module > Can access admin dashboard